

WE ARE PROUD TO PARTNER WITH 75% OF THE GLOBAL 2000 INCLUDING


WE ALSO WORK WITH KEY INDUSTRY LEADERS


Featured Resource
Revolutionizing finance & procurement: Strategies shaping the future in 2024
Our in-depth report shares tactics on how S2P professionals can work in better alignment and more effectively leverage data to create a healthy, agile business.
Plus, you’ll discover how 60+ finance and procurement professionals are navigating the evolution of S2P in 2024.

Realizing the value in your data
S2P analytics deliver key insights
Harness your source-to-pay data's full potential to unlock savings, efficiencies, and revenue-driving opportunities that contribute to the overall health of the business.
Achieve healthier marginsRecover. Discover. Prevent.
Empower your finance, merchandising and procurement teams to expand their impact with technology-enabled profit recovery and contract compliance services and software solutions.
Recover more profit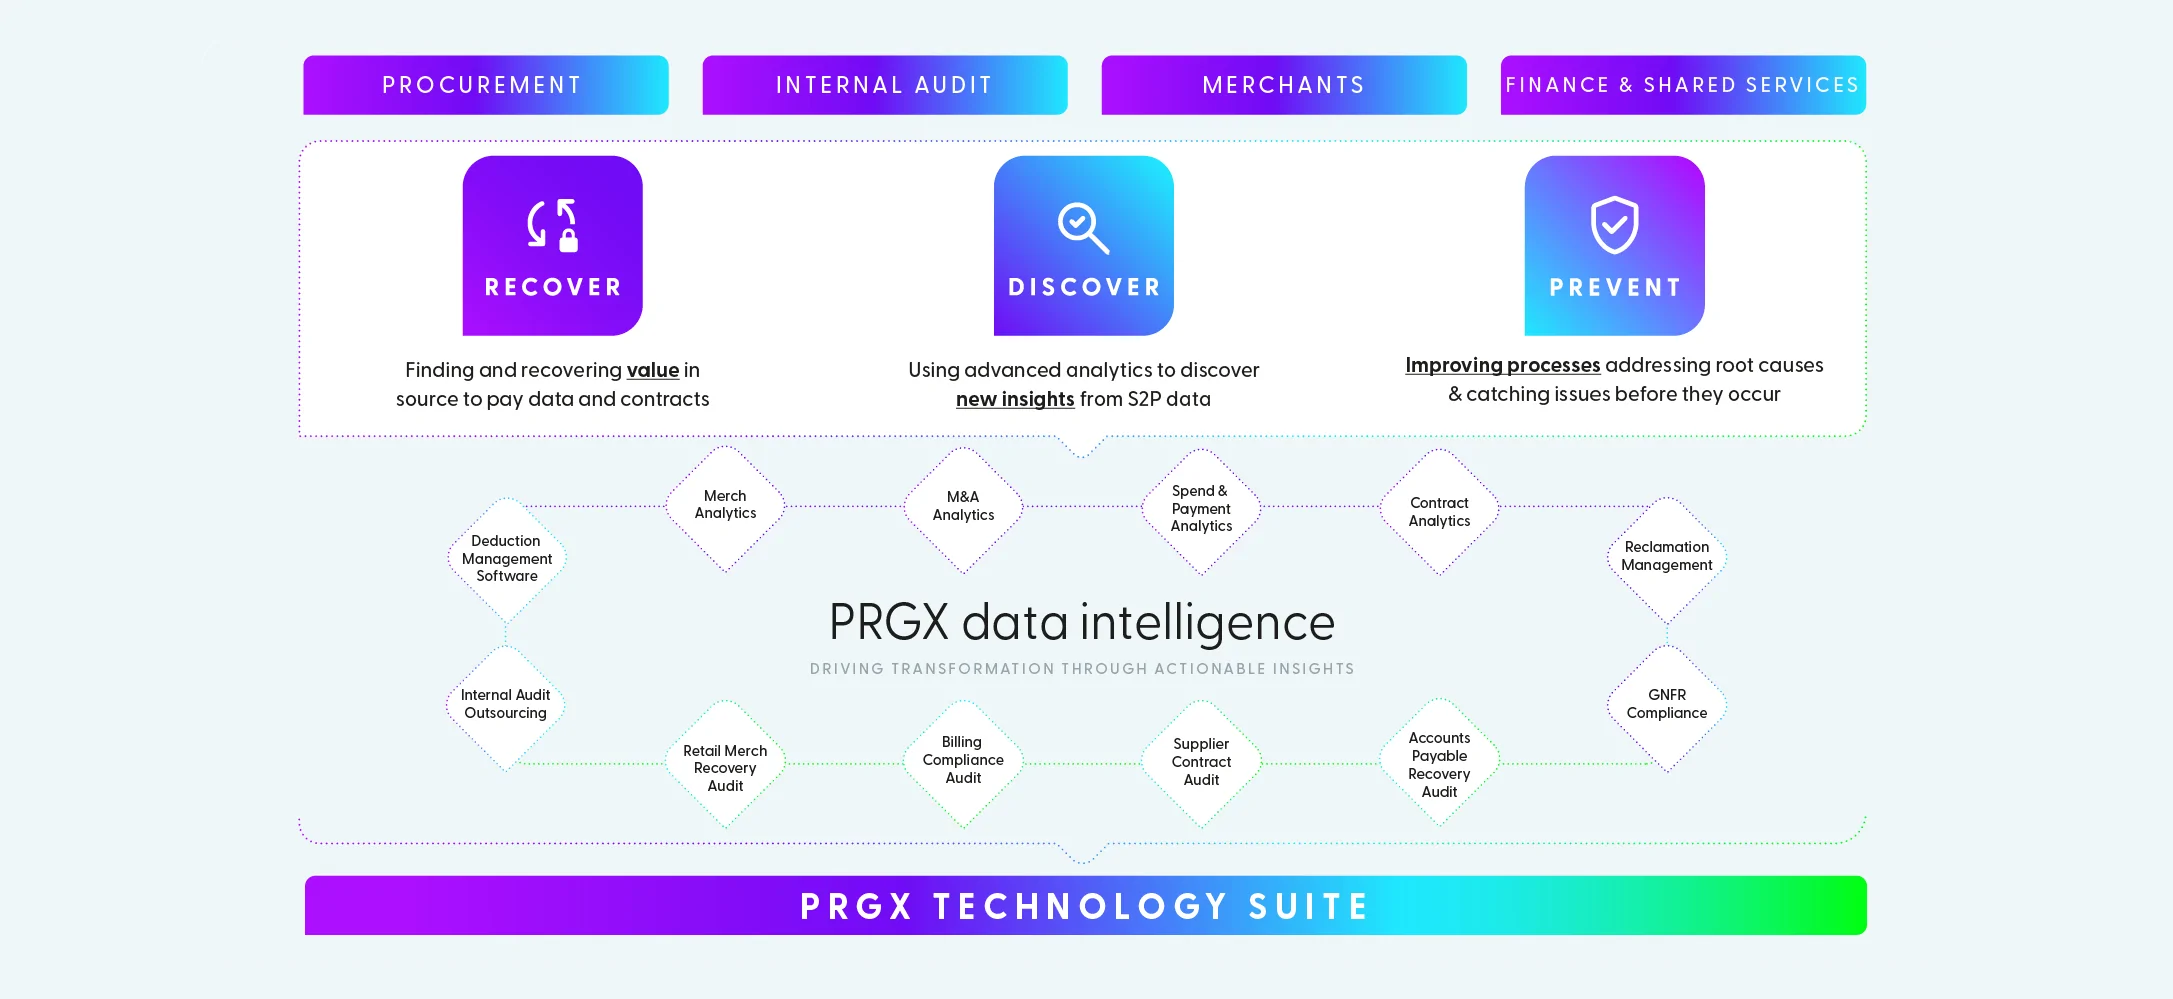
Platforms to grow relationships and margins
Experience the power of supplier collaboration with vendor relationship management software. These technology platforms are built to nurture valuable partner relationships and increase business transparency.
Start collaborating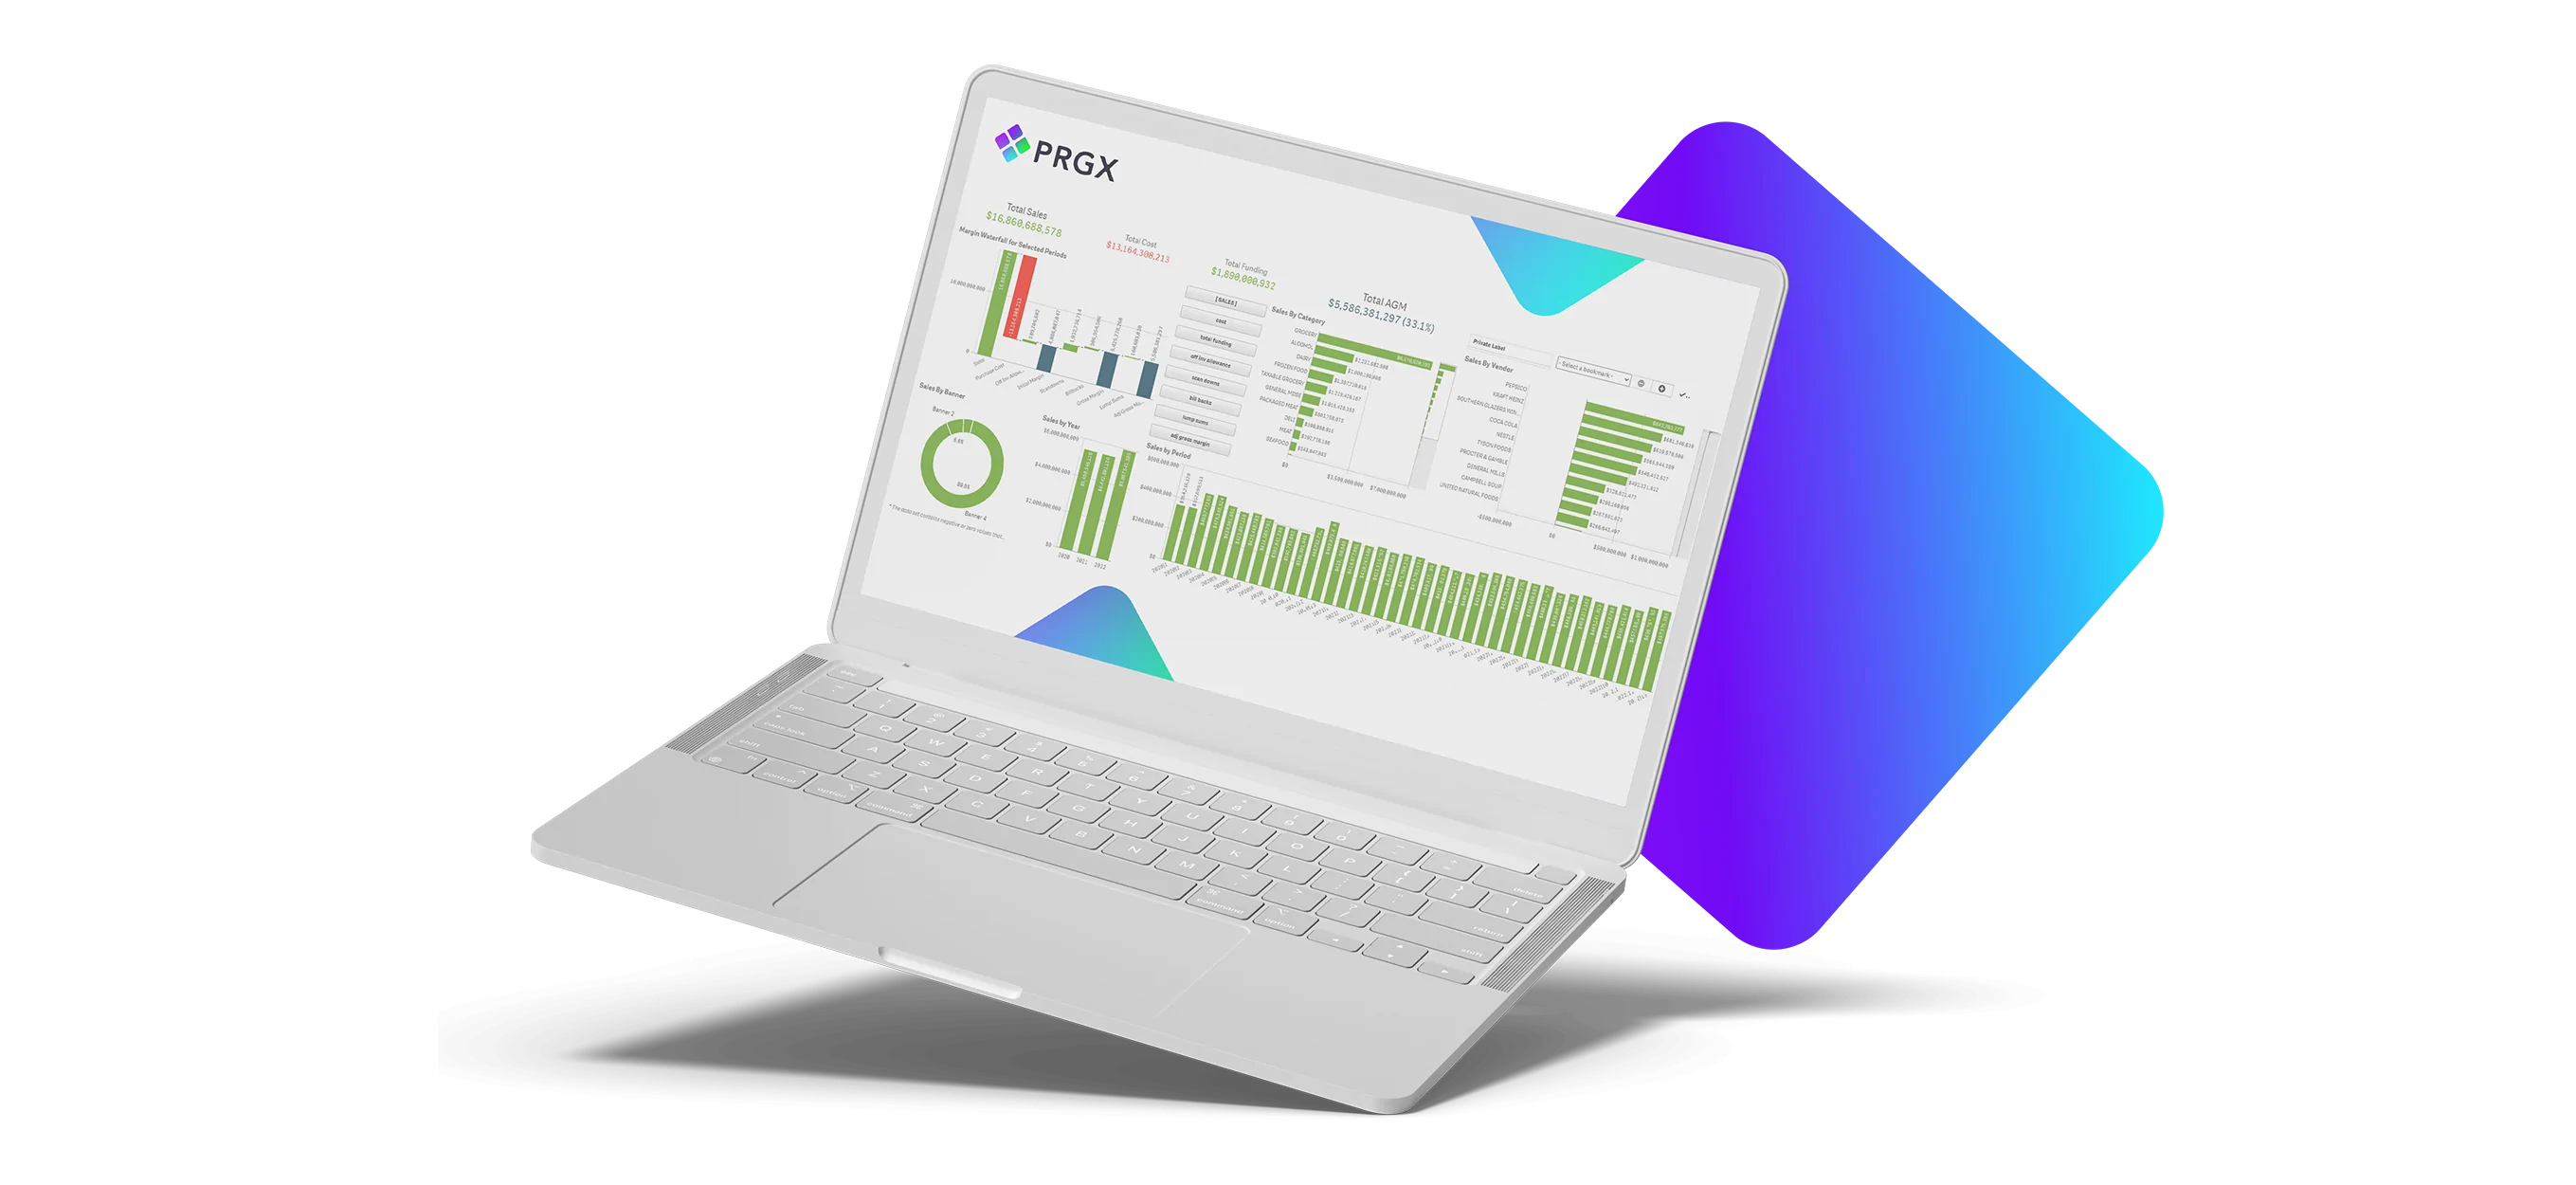
Solutions to help businesses thrive
Merchandising & Category Management
Providing the data intelligence to ensure contract compliance, improve negotiations and enhance purchasing decisions.
Finance & Shared Services
Optimizing processes and providing full data visibility to guide strategic financial planning and drive stronger profits.
Procurement
Balancing nurturing supplier relationships, ensuring compliance and recovering profit to realize the true value in contracts.
Internal Audit
Deep diving into data and processes to identity operational improvements and profitable opportunities.
JOIN US FOR PRGXCHANGE™
The global premier conference for leaders in finance, procurement, shared services and merchandising.
Each year, industry leaders share insights, engage in robust discussions, and explore a vision for the future of S2P, analytics and business intelligence.
Join us for 2024 in Las Vegas, September 22-24. Be sure to register your interest and be the first in the know!
Learn more